
When Development Capacity Is Not the Constraint
A Summary of the Project to Product State of the Industry Report Findings

Over eight years of giving presentations about the shift from Project to Product, there is one slide that I used more than any other. Whenever I put the graphic below up in a meeting, I would usually see one executive in the room look at another and say “this is us.” If they said it loud enough, I would point out that this 8% figure is aggregated from telemetry across thousands of real software value streams. And then I would ask what percentage of the end-to-end flow time at their organization involved value creation. Not once across hundreds of meetings did an executive have a precise number, just a gut feeling that the number was not much better than 8%.
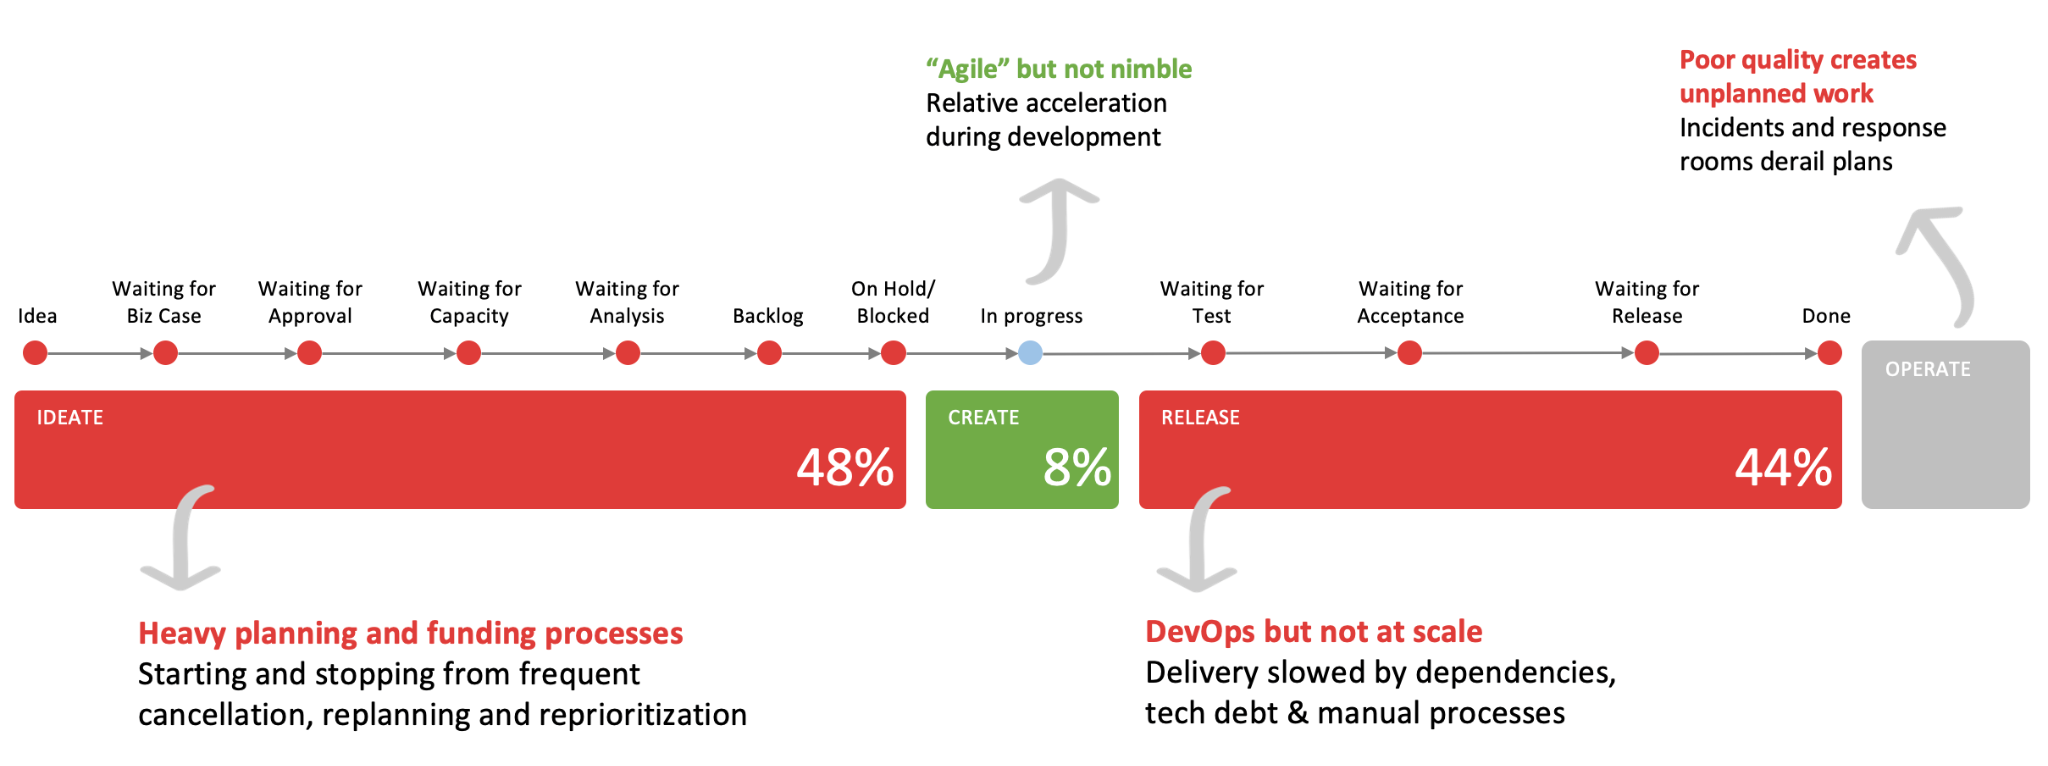
The Theory of Constraints teaches that accelerating a part of the process that is not the bottleneck will not improve overall throughput. What this data shows is that many organizations have massive constraints upstream and downstream of teams. AI and agentic coding make it possible for teams to deliver many times faster than they did previously. But if you increase the output of teams tenfold, while upstream ideation and downstream release constraints remain unchanged, your end-to-end throughput does not improve, regardless of how much you are spending on tokens.
That is one of the core problems that Output to Outcome (available July 14) tackles as organizations move toward AI-native operating models. The purpose of this article is not to outline the mechanisms that make it possible for organizations to solve this problem. It is to provide more of the data behind this chart and to summarize some of the other findings described in Output to Outcome from the Project to Product State of the Industry Report. While the most recent data is now nearly two years old, for many organizations it will still be representative of the operating-model constraints that slow the realization of AI’s benefits.
Generating cross-tool and cross-vendor data for enterprise organizations’ value streams is challenging, which is why so many industry reports rely on survey data. Back in 2016, my team at Tasktop and I realized that the data flowing through our value stream integration solution provided a uniquely useful data set to study and analyze. In 2017, Nicole Forsgren and I wrote a summary for ACM Queue on how this data can be used, titled DevOps Metrics: Your Biggest Mistake Might Be Collecting the Wrong Data. In the following years, I wrote summaries of the first findings for IEEE Software, called Mining the Ground Truth of Enterprise Toolchains and What Flows through a Software Value Stream? I also included parts of the data set in Project to Product.
The data set grew as Tasktop’s customer base grew, and our data science team continued to iterate on the underlying telemetry and analysis. Tasktop was then acquired by Planview, and we released further iterations on the studies in the 2023 and 2024 Project to Product State of the Industry Report. Those reports extended the telemetry analysis and supplemented it with survey data.
All of the data summarized here has previously been publicly available and published in the various reports linked at the end of this article. The goal of this article is to bring the findings together for readers who want a concise view of the key data and its implications. For further reading on the findings and implications, see Output to Outcome.
– The following has been co-written with AI –
The core finding: only 8% of flow time is spent creating
Across thousands of real software value streams, our telemetry shows work moving from idea to production in three broad phases: Ideate (48%), Create (8%), Release (44%). Only 8% of total flow time is spent in active development — the phase business leaders fixate on improving. The other 92% is lost upstream to planning, funding, and approval churn, and downstream to testing, dependency, and release friction. This is the chart behind Figure 1.1 in Output to Outcome, “When Development Capacity Is Not the Constraint,” drawn from the same Planview/Tasktop Viz value-stream telemetry that underpins the report’s systems-data findings. It is the central, counterintuitive fact this research program kept confirming: making developers faster did not necessarily make organizations faster, because development was often not the bottleneck in the value streams studied. The two surveys below explain why — and what separates the organizations that have actually fixed it.
On the source: this is corporate-sponsored research — Planview sells value stream management software and benefits commercially from this narrative. However, it is, to my knowledge, the only research combining self-reported survey data with anonymized telemetry from thousands of real production value streams. Treat the directional findings as meaningful and informative; treat individual percentages as vendor data, not peer-reviewed fact.
2023 Study: Setting the Baseline
Methodology. The 2023 Project to Product State of the Industry report (Planview, 2023) surveyed 326 individuals from 253 companies between April and December 2022, scoring each respondent’s organization across seven dimensions of change and mapping the result onto a five-stage maturity model: Starting Out, Experimenting, Expanding, Operationalizing, and Approaching Maturity. That survey was paired with systems telemetry from 3,600+ value streams across 34 organizations, captured through what was then Tasktop Viz. To identify which practices actually predicted advancing through the model, a Firth logistic regression was run against the survey responses.
Headline. 92% of organizations were still in the first three, exploratory stages; only 8% had reached Operationalizing or Approaching Maturity. The report frames the stakes with a 2022 McKinsey estimate: companies with more than $1 billion in revenue need to launch roughly seven new, largely software-dependent businesses a year over the next five years to meet growth expectations (McKinsey & Company, 2022) — a pace that depends on exactly the kind of delivery speed most organizations don’t yet have.
What predicted progress — five attributes:
Continuously funded build-and-run teams. Only 12% of respondents used a flexible, continuous funding model; 37% — more than a third — were still funded exclusively through annual project budgets. The systems data showed what that costs: business leaders believed their IT teams could deliver roughly ten times their actual capacity, and only 8% of what Agile teams planned actually got delivered.
Self-service dependency management. 87% of respondents said they were impacted by technical, process, or skill dependencies, or delayed by handoffs and coordination with shared services; only 5% had reached a fully self-service model. On the systems side, 30–40% of end-to-end delivery time went to testing and release activity alone, and finished code commonly sat idle for three or more months before release.
Fast feedback speed. Only 10% of respondents had all products on a fully automated, independent path to production enabling weekly feedback; 46% said they couldn’t incorporate customer feedback faster than quarterly, or at all outside an emergency. Systems data found 55% of value streams carrying roughly twice the work their capacity could handle — when new work arrived, in-flight work was routinely paused to accommodate it.
A mature product management function. 41% of respondents said a single business stakeholder still dictated features and priorities; only 15% had product managers acting as long-term custodians of vision, roadmap, and viability. 80% of value streams weren’t proactively allocating capacity to technical debt, and a separate cut found 90% weren’t proactively funding security and compliance work either.
Flow metrics tied to business outcomes. Only 8% of respondents had flow metrics and business outcomes built into operational reviews at every level of the organization; fewer than 10% of value streams regularly reviewed flow metrics against business results.
What blocked it. Two attributes actively decreased the odds of operationalizing the shift: weak product management (when one stakeholder dictates the backlog, only features get funded, and risk and technical-debt work go neglected) and weak customer centricity — 52% of respondents had no programmatic feedback mechanism with their customers at all, internal or external. One industry-specific note worth keeping: in the Energy and Financial Services industries specifically, the report found that the likelihood of operationalizing the model increased when value was “well-defined and served as a focal point for every team member” — a reminder that in those sectors particularly, this transformation depends as much on leadership communication as on tooling.
2024 Study: Tying to Business Performance
Methodology. The 2024 report drew on 305 new respondents surveyed in June–July 2024 across six geographies and nine industries, supplemented by 300 respondents from Planview’s ongoing Project to Product Maturity Assessment — explicitly the same instrument used as the basis for the 2023 report, which is what makes the year-over-year maturity comparison sound. Systems telemetry expanded to 8,000 value streams via Planview Viz, more than double 2023’s sample. The methodological shift in 2024 was a new performance-tier lens: alongside maturity stage, respondents were segmented by how consistently they met quarterly business objectives — Elite (>90% of the time), High(>70%), Medium (50–70%), and Low (<50%) — with findings presented mostly as descriptive comparisons across those four tiers rather than through a named regression model like 2023’s.
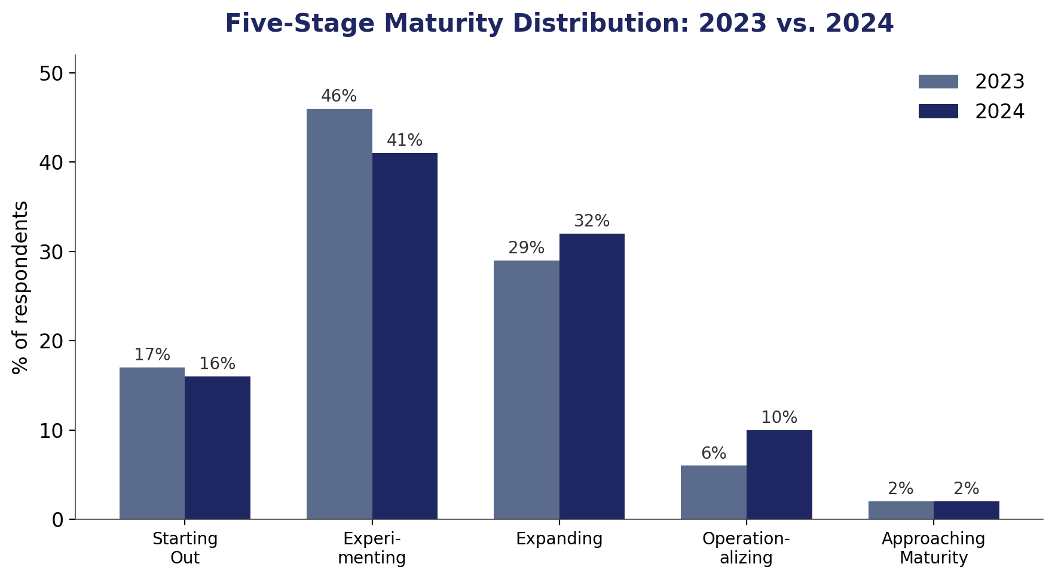
Headline. Elite organizations run about half their work through a product operating model, versus 75% project-based work at Low performers — roughly twice the product-oriented work and about a third of the wasted development effort. The report ties this to an external benchmark: McKinsey found that companies in the top quartile of product/operating-model maturity post 60% greater total shareholder returns and 16% higher operating margins than the bottom half (McKinsey & Company, “The bottom-line benefit of the product operating model,” accessed Sept. 12, 2024). On the same five-stage scale used in 2023, the share of organizations in the two most mature stages rose from 8% to 12% — modest but real movement, mostly organizations advancing one stage at a time rather than leaping to maturity.
Despite that progress, 97% of all respondents — regardless of performance tier — still cited at least one significant roadblock; only 3% said nothing stood in their way. The most common barriers were not having a clear, shared vision of what the product operating model means for the organization, and being unable to see the organization as an interconnected value stream network — leadership-level gaps, more than team-level ones.
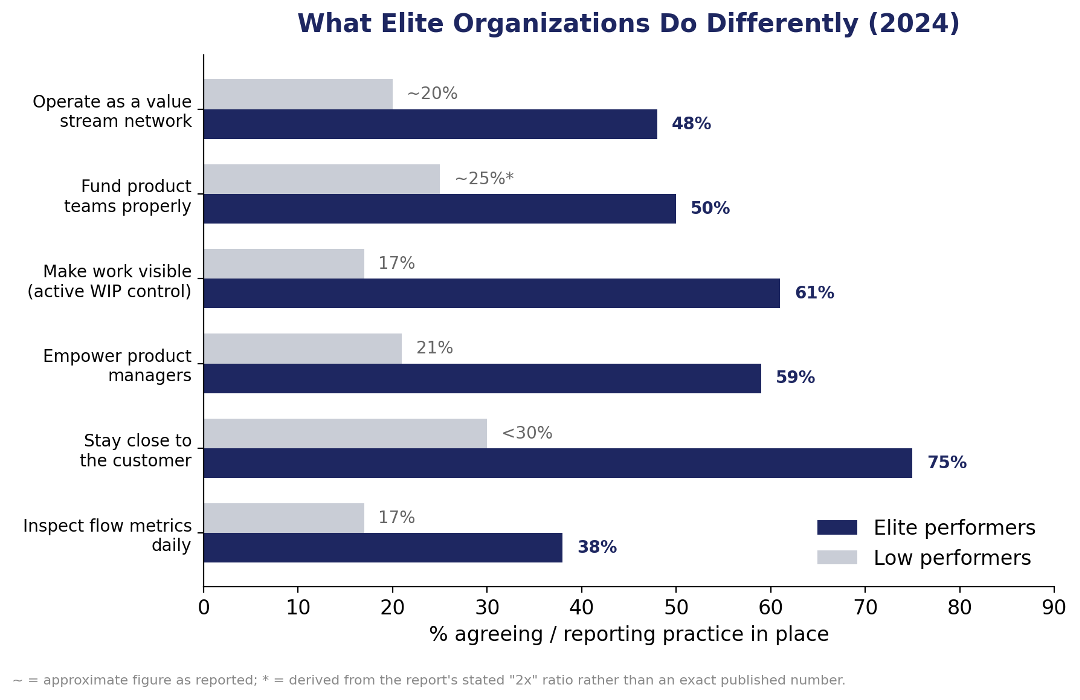
Eight things Elite organizations do differently:
Operate as a value stream network. 48% of Elite organizations say everyone knows which value streams they contribute to and leaders can see the whole network, versus roughly 20% of Low performers.
Understand and measure customer value. Higher performers are about twice as likely to actively define, document, and measure customer value, typically through OKRs cascading from enterprise goals to product areas.
Fund product teams properly. 50% of all respondents say their organization has an enterprise-wide model aligning project-based planning with product-based funding — more than double the rate at the lowest performers. Even so, 65% of organizations overall are still underfunding technical debt, putting less than 10% of work toward modernization.
Make work visible. 61% of Elite organizations agree work is visible to everyone and WIP limits are actively controlled, against just 17% of the lowest performers. Typical organizations waste about 15% of effort on canceled work; that climbs to nearly 30% among the worst performers.
Empower the product manager. Fewer than 35% of all respondents agree product managers are adequately empowered — but that’s 59% among Elite organizations versus 21% among the lowest performers. The report specifically warns against “relabeling” — renaming business analysts or PMs without changing their actual authority.
Stay close to the customer. 75% of Elite and 60% of High performers agree employees maintain strong customer relationships and get feedback on their work, versus under 30% of the lowest performers. Only 15% of all respondents have every product on an automated path enabling weekly feedback.
Inspect flow metrics daily. 38% of Elite organizations say all teams inspect flow metrics daily and connect them to business outcomes, versus 17% each at Medium and Low — and 71% of the lowest performers actively disagree they do this.
Protect teams from burnout. Pressure is high across every tier — burnout doesn’t track neatly with performance. But of the small group (13%) reporting no burnout symptoms at all, nearly two-thirds came from Elite or High-performing organizations.
Comparing the Two Years
The question itself shifted. 2023 asked what predicts advancing through the maturity model; 2024 asked what already-winning organizations do differently, then tied that directly to business performance via the McKinsey benchmark (McKinsey & Company, 2024). That’s a stronger claim, and anyone citing both years should be precise about which one they’re invoking.
Real progress did occur — the 8%-to-12% shift in the top two maturity stages is the clearest year-over-year evidence, and it came mostly from organizations moving out of “Experimenting” and into “Expanding” and “Operationalizing,” not from any leap to full maturity (which stayed flat at 2% both years). But the structural gaps are nearly identical across both reports: technical debt remained chronically underfunded in both years (80% of value streams not proactively funding it in 2023, 65% of organizations under the 10% modernization threshold in 2024); feedback speed improved only marginally (10% could act within weeks in 2023, 15% in 2024); and empowered product management remained the exception in both (41% still backlog-dictated by a single stakeholder in 2023, fewer than 35% saying PMs were adequately empowered in 2024). Both sets of findings indicate that most organizations are still losing the bulk of their flow time to planning and release friction, not to development itself.
Caveats. Both survey samples are self-selected — people already engaged enough with this topic to take a Planview-administered survey or assessment, which likely skews toward organizations already bought into the product-operating-model conversation. All performance and maturity data is self-reported, not independently audited. And the systems telemetry, while a genuinely unusual asset, comes only from organizations already using Planview’s tooling — not a random sample of the software industry. Use the directional findings — chronic technical-debt underinvestment, the rarity of true operationalization, the emerging link between product orientation and business performance — with confidence. Use individual percentages as vendor-sourced data points, not independently verified statistics.
Sources
Kersten, Mik. Output to Outcome, Figure 1.1, “When Development Capacity Is Not the Constraint”.
Project to Product: 2023 State of the Industry Report. Planview, 2023.
Project to Product: 2024 State of the Industry Report. Planview, 2024 (doc. ref. RR438LTREN; registration required).
Kersten, Mik. “Five Steps to a Product Operating Model.” P2P Summit Keynote, October 2024.
Kersten, Mik and Puisite, Mara. “Operationalizing the Shift from Project to Product.” 2023 Project to Product SOTI Webinar, April 2023.
McKinsey & Company. “The Bottom-Line Benefit of the Product Operating Model.” Accessed September 12, 2024.
McKinsey & Company. “New-Business Building in 2022: Driving Growth in Volatile Times.” November 2022. As cited in Planview’s 2023 SOTI Report.
Gartner. “Gartner Survey Finds 85 Percent of Organizations Favor a Product-Centric Application Delivery Model.” February 2019, based on a 2018 survey.
Forsgren, Nicole and Kersten, Mik. “DevOps Metrics: Your Biggest Mistake Might Be Collecting the Wrong Data.” ACM Queue 15(6), 2017.
Kersten, Mik. “Mining the Ground Truth of Enterprise Toolchains.” IEEE Software 35(3), 2018.
Kersten, Mik. “What Flows through a Software Value Stream?” IEEE Software 35(4), 2018.
Kersten, Mik. Project to Product: How to Survive and Thrive in the Age of Digital Disruption with the Flow Framework. IT Revolution Press, 2018.
The high cost of coordination makes me doubt how we currently organize, not only across product development, but the whole organization, really...
“The core finding: only 8% of flow time is spent creating”
This is such an important point, Mik.
Your work, writing, offerings, and collaboration have been a real backbone of my thinking and of my previous organization’s transformation.
We spent 6+ years improving technology delivery: better Agile practices, smaller batches, trunk-based development, more frequent deployments, and roughly 80% improvement in build and delivery performance.
By the time we adopted Value Stream Management in 2022, delivery was already far more efficient.
The harder conversation for me was expanding the lens beyond delivery.
That is where I saw the most resistance. Organizations often want to keep productivity inside engineering because it feels measurable and controllable. But if only a small percentage of flow time is spent creating, then the opportunity is much broader.
The real leadership opportunity is improving product productivity across the full path from ideation to production, adoption, and realized value.
I’m looking forward to reading your new book!